Read the geometry before reading the color
A grid report is a set of searches at selected locations. Its shape and spacing determine which locations contribute to the metric. A business can look stronger in a smaller or differently shaped sample even when no rank changes. Start by identifying the exact center and what the tool means by radius. The source's coordinate and zoom settings describe search inputs; the app's grid-generation rules describe the sample you chose.
Source checks: Google Maps live advanced SERP results · Tips to improve your local ranking on Google
Separate square half-width from circular radius
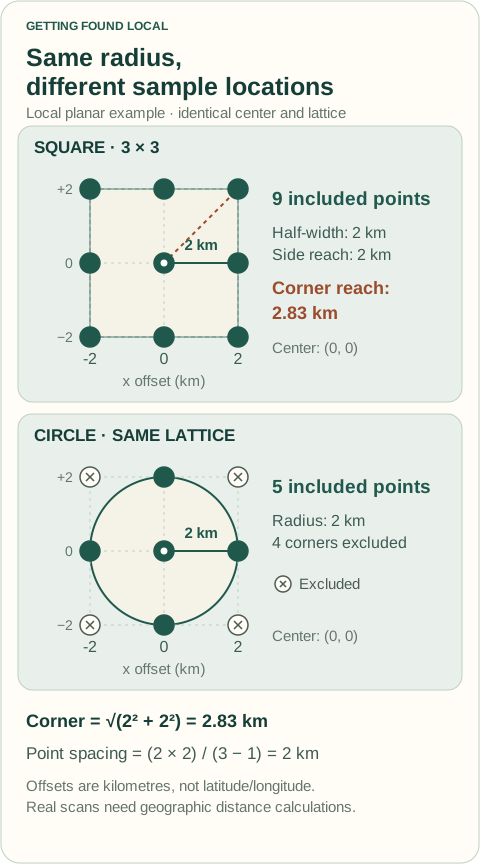
If a square grid's radius means distance from center to the side midpoint, the corners are farther away by approximately the square root of two for a small local planar example. A clipped circular grid retains only points inside its stated distance limit. Do not assume both grids cover identical locations because their radius input displays the same value. Tools may define radius differently, so read the actual coordinate output and documented convention.
Calculate spacing for the chosen size
For a square with half-width R and n positions across a side, local planar spacing is approximately 2R ÷ (n − 1). Increasing n at the same R creates more samples between the same boundaries. That does not enlarge the service area or manufacture demand. Actual geographic coordinates should be generated with appropriate geographic calculations rather than treating one degree of longitude as the same ground distance at every latitude.
Use exclusions as a documented sampling choice
A circle clipped from a square lattice has fewer included points than the original square. Deliberate removals for water or an irrelevant area change the measured sample too. Record them before running and report included counts. Excluding weak observed locations afterward would make a favorable percentage by changing the question, not by improving the business. If exclusions are appropriate, preserve the rule consistently in the next baseline comparison.
Do not interpret point coverage as population share
Equal weighting gives each successful included point the same contribution to the coverage score. It does not establish that every point represents equal population, search activity, or revenue opportunity. A dense grid is still a sample of ranking observations. For operational decisions, pair the geography with genuine service capacity and inquiry records. Never multiply a coverage percentage by a fabricated local search volume to invent missed customers.
Compare like geometry or explain the new question
Hold center, shape, radius convention, size, exclusions, and search settings stable for performance comparisons. If the business wants to study a new area, create a new baseline and label the change. Inspect actual coordinates near important boundaries rather than relying on an attractive outline. The useful report explains the geographic question being asked and how the sample supports it, with no claim that choosing a larger grid changes organic rank.
Worked example: illustrative figures
Illustrative local planar example: a 3×3 square with half-width 2 km has positions at −2, 0, and +2 km on each axis. Side-midpoint distance is 2 km and corner distance is √(2² + 2²) ≈ 2.83 km. Clipping the same lattice to a 2 km circle retains five points: the center and four side midpoints. A 5×5 square at the same half-width has approximately 1 km spacing instead of 2 km. These are geometry calculations, not actual customer densities or a promise of scan accuracy at every latitude.
Your practical checklist
- Record the exact grid center.
- Write what radius means in the selected tool.
- Check actual included coordinates and spacing.
- Preserve deliberate exclusion rules.
- Do not equate equal point weighting with population share.
- Create a new baseline when the geographic question changes.
Your next action
Export or inspect the chosen grid coordinates and compare its corner distance, included count, and spacing with the stated radius.
Questions about this task
Does a bigger grid improve my Maps ranking?
No. It changes the geographic sample you observe. The business's ranking is not improved by selecting more scan points.
Can I compare coverage from a square and circle directly?
Only with an explicit explanation that the sampled locations differ, or using a defined common point set. Otherwise geometry can explain part of the percentage change.
Sources and editorial notes
Prepared with AI-assisted research. Official sources are linked below; worked examples and checklists are Getting Found Local recommendations, not measured client outcomes.
Sources checked October 13, 2026. Platform interfaces and local resources may change; follow the current instructions on the linked official page.
How we research, illustrate, and update these guides · Suggest a correction